Hi Elliott Waver,
Fibonacci numbers follow a sequence that begins with 0 and 1, and each subsequent number is the sum of the previous two (0, 1, 1, 2, 3, 5, 8, 13, 21, 34, 55, 89 and so on).
After the first several numbers in the sequence, the ratio of any number to the next higher is approximately .618 to 1; its ratio to the next lower number is approximately 1.618 to 1. This is known as the Golden Ratio.
Fibonacci ratios appear everywhere in nature, from the shape of galaxies and seashells to molecules and the human body. And remarkably, they also show up in the movement of stock prices.
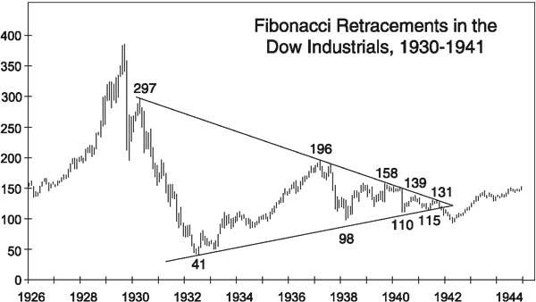
Long- and short-term market charts are often filled with Fibonacci relationships. Here's an example from history, which shows the Dow Industrials from 1930 through 1941: