We have published a new article in our blog.
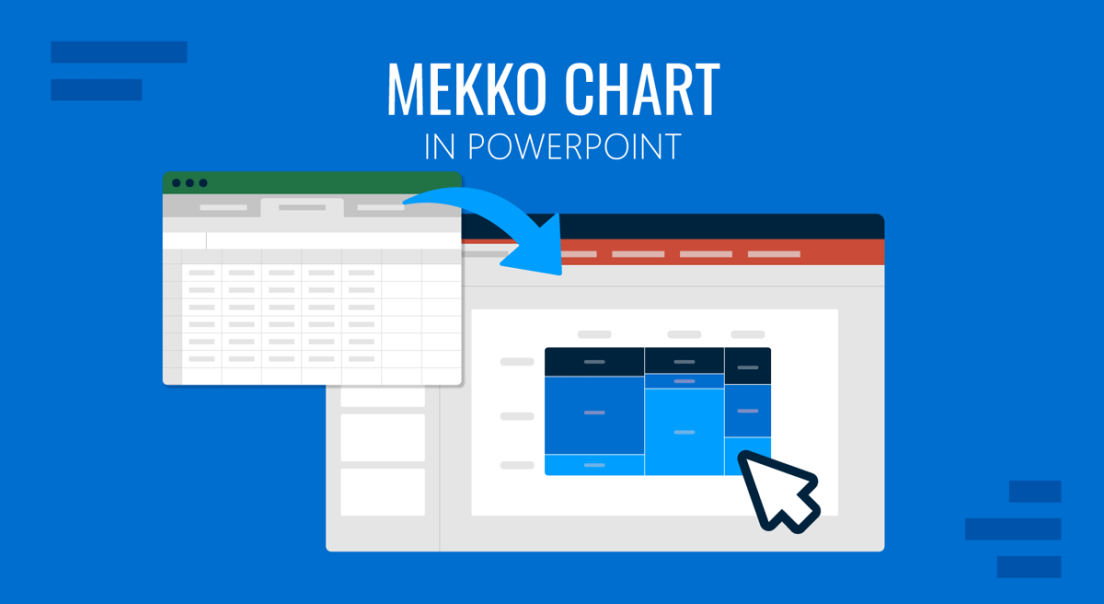
A Mekko chart is one of the few visuals that shows market size and composition at once. Here’s how to build, design, and present it effectively.
Previous articles from our blog:
Customize your presentation slides by learning how to make bubble letters in PowerPoint. Step-by-step instructions and insights.
Struggling to explain leadership styles? Use the Blake and Mouton Managerial Grid to visualize the balance between task efficiency and team well-being.
Check out some of our latest templates, 100% Editable and ready to use in your presentations.
Do you have any questions?Contact our 24/7 Support Center: support@slidemodel.comFeel free to email us at any time.