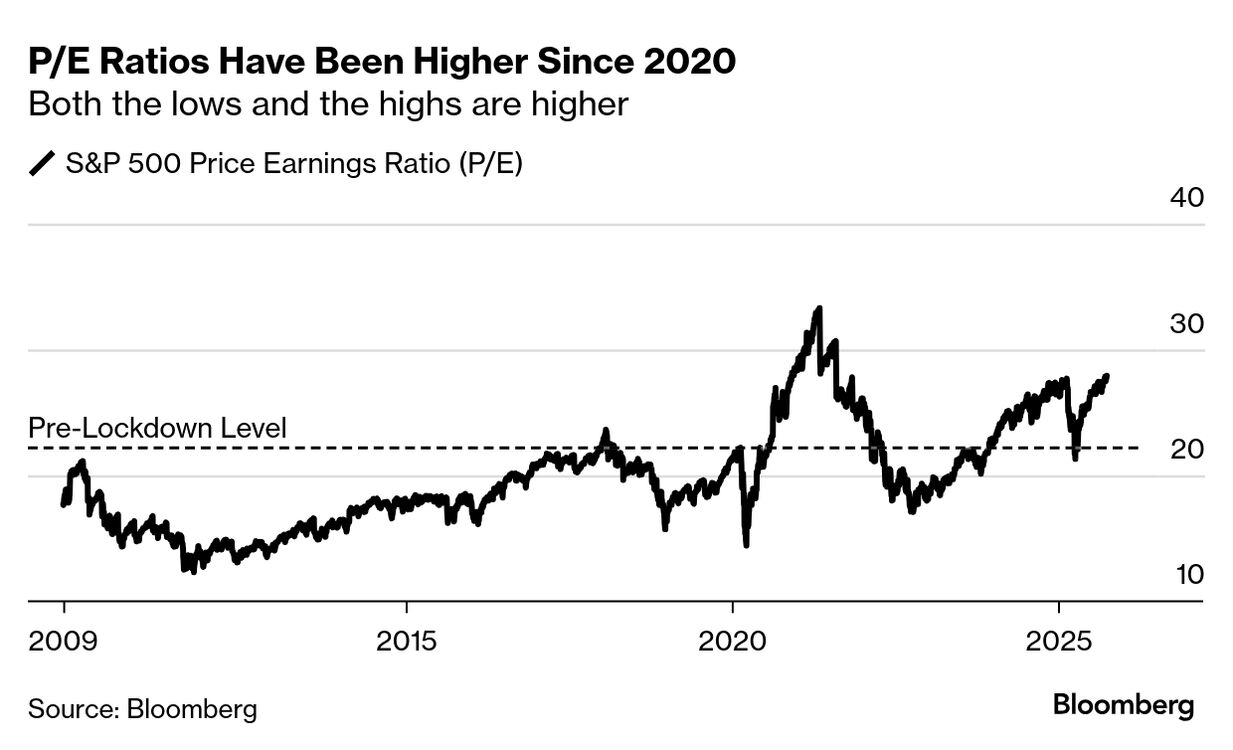
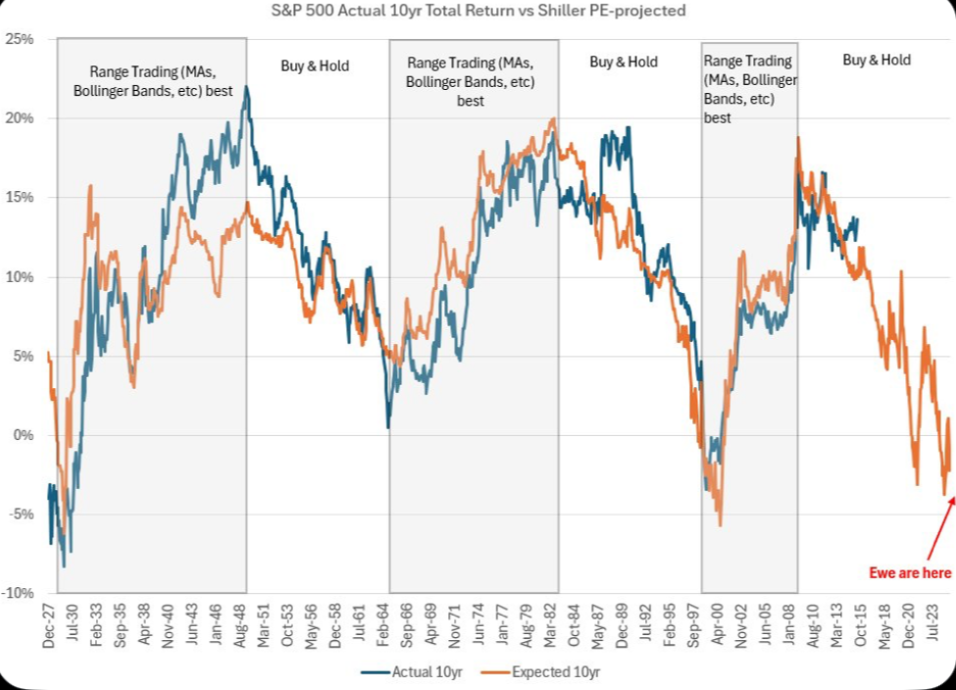
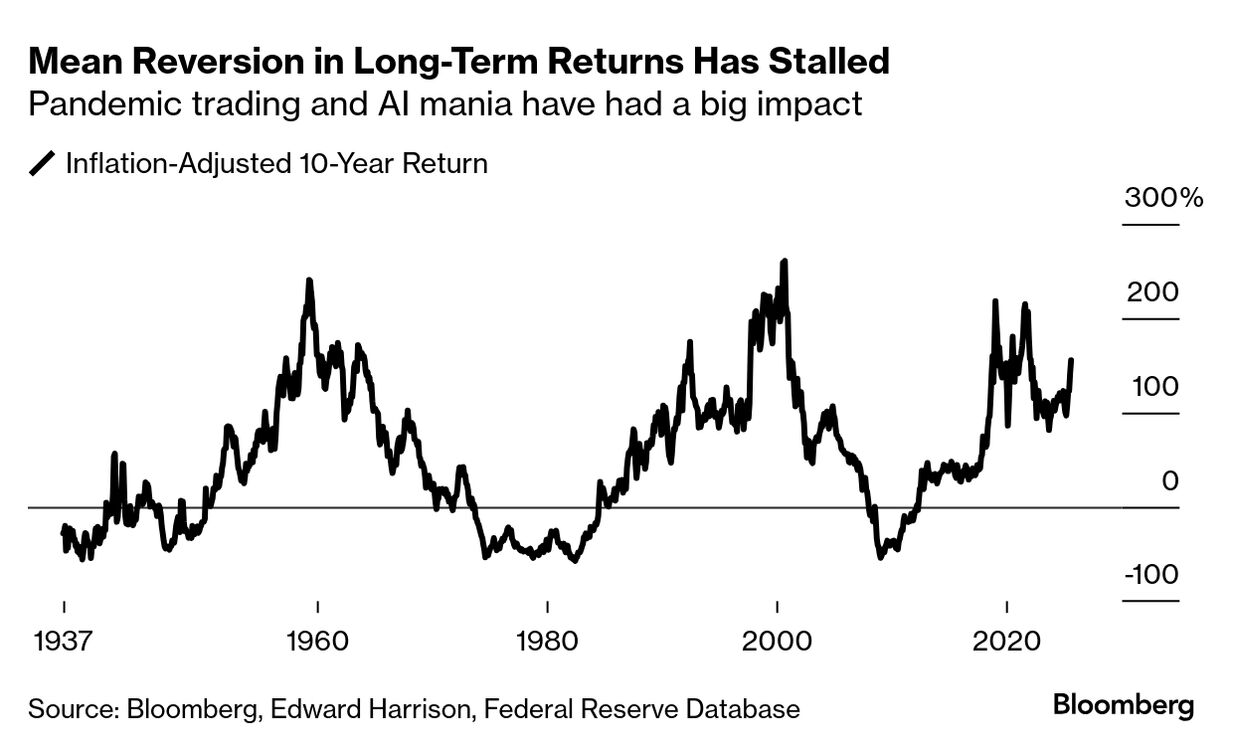
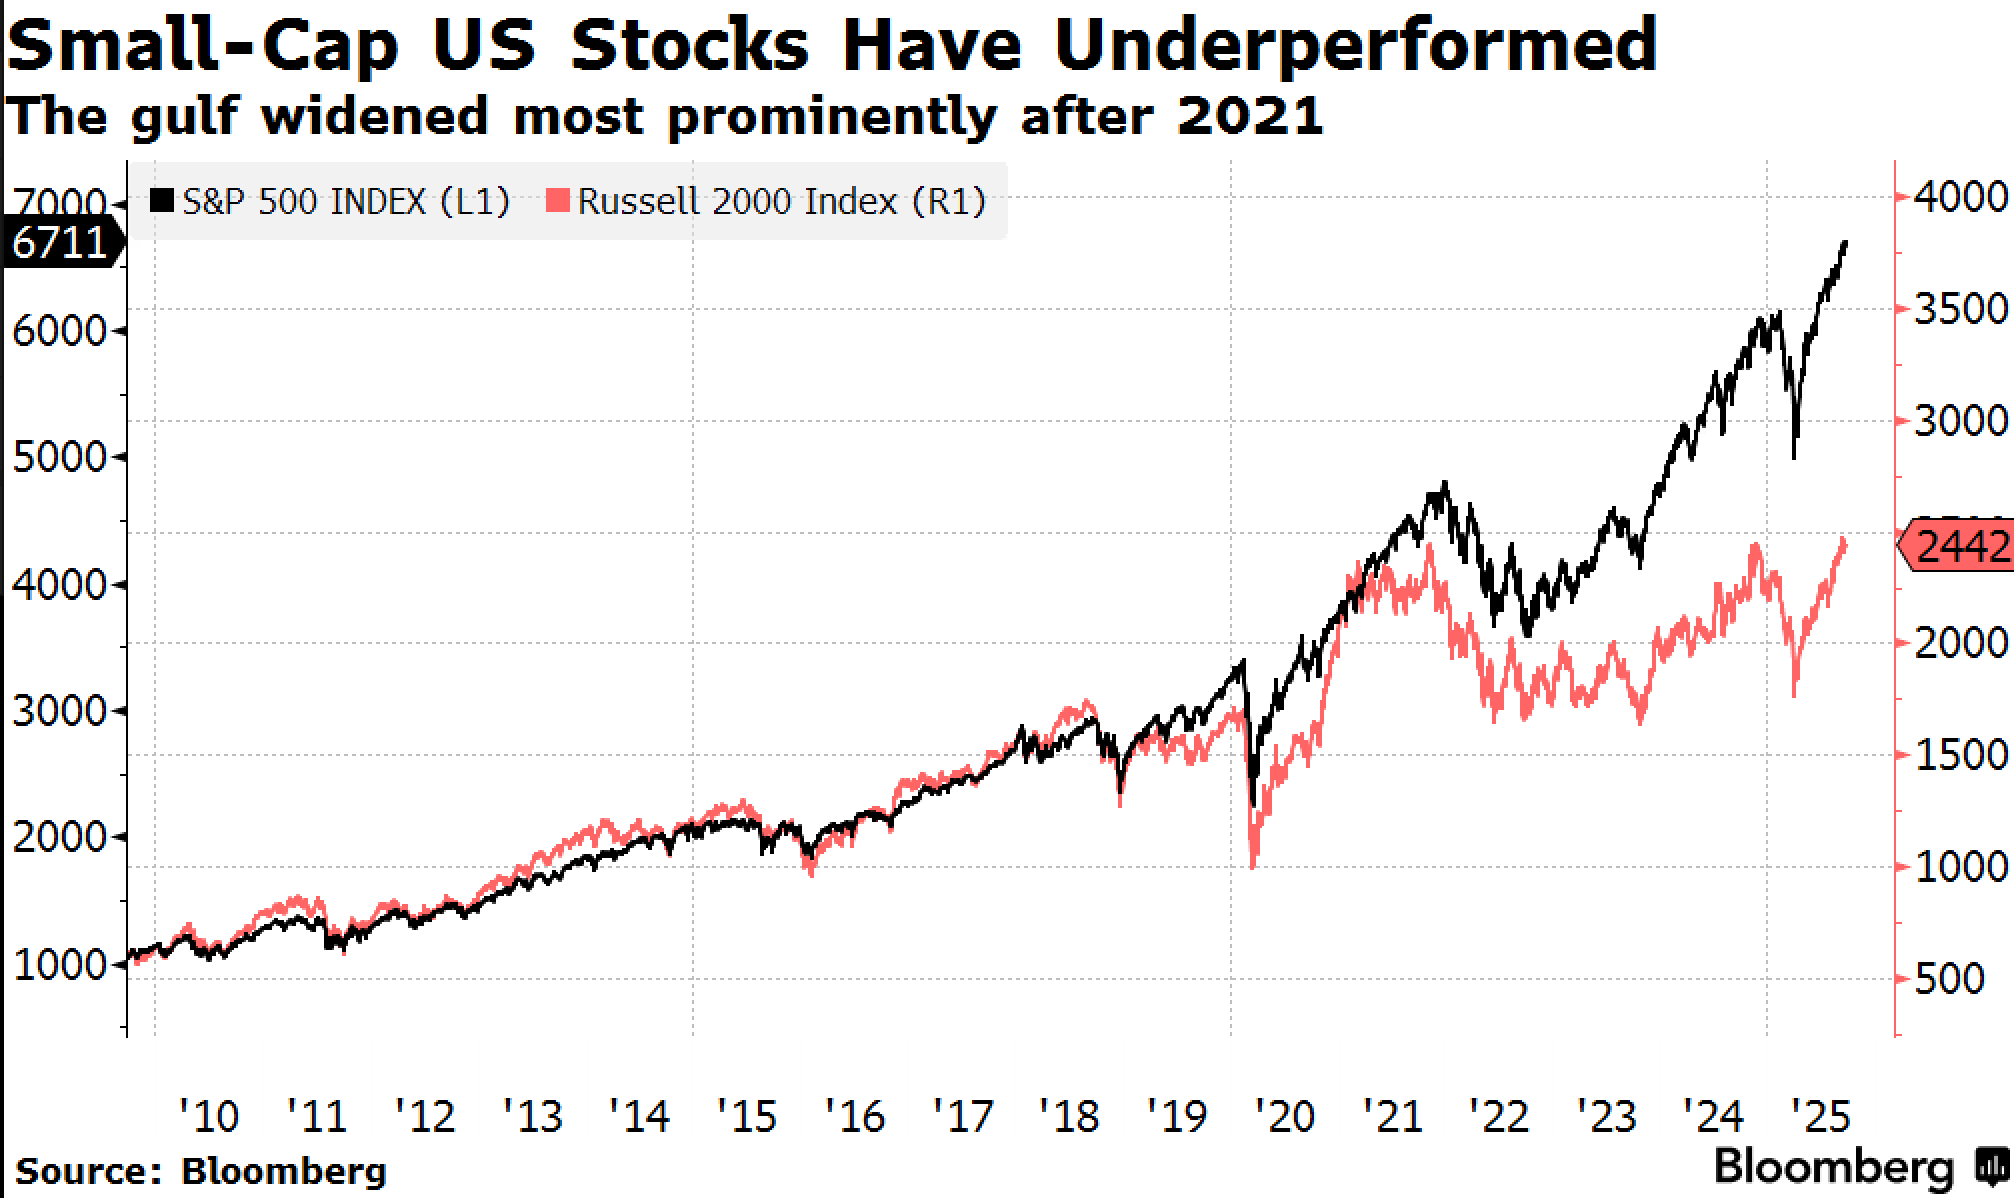
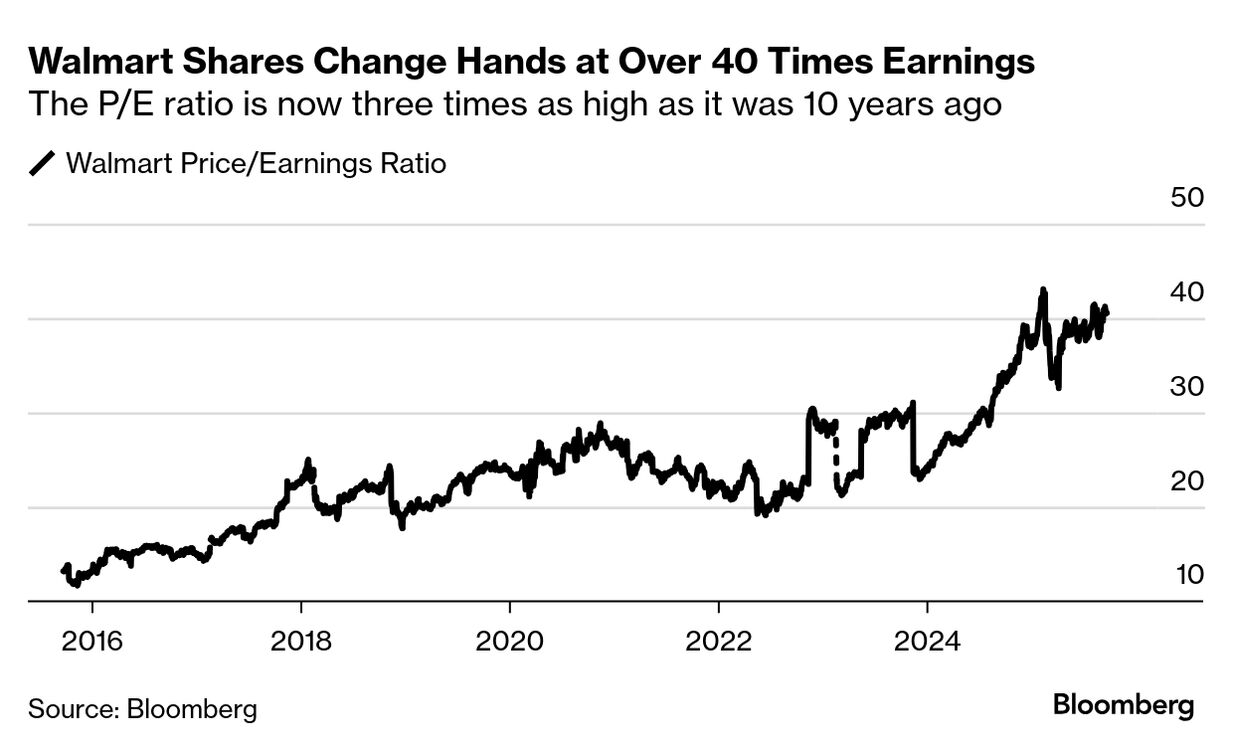
| Green argues that the mean-reverting nature of equity returns is well-documented in investment research and valuations will eventually decline. This is the central conceit of a cross-business cycle valuation metric like the Shiller PE, commonly known as the CAPE (the cyclically adjusted price earnings ratio). It is the price of a stock divided by the average of ten years of inflation-adjusted earnings. Green showed me a chart of rolling 10-year nominal returns that looks very similar to the inflation-adjusted ones I’ve been using. The numbers peaked for returns from 2009-2019, with the subsequent returns predicted by the rising Shiller PE suggesting a steep fall in returns, even losses. I re-ran my decade-long inflation-adjusted S&P 500 returns chart through September and it tracks Green’s chart closely. (Note: my chart dates look back 10 years to realized returns while Green’s chart shows subsequent returns in order to map the path of returns predicted by the Shiller PE). Another consequence, as Green puts it, is that the largest capitalization stocks, which make up the biggest share of cap-weighted indexes like the S&P 500, gain disproportionately. I overlaid a chart of the Russell 2000 on the S&P 500 to make that point clear. Since the peak in shares, the S&P 500 has far outperformed the Russell, whose performance in the last several years is more typical of the reversion to the mean you see after euphoric tops. Small cap and large cap stocks were rising in concert up until we hit a peak in 2019. However, once returns started to fall, larger caps took off. The pandemic trading bubble closed the gap almost entirely as everything went up in price. It widened again once the Fed’s rate hikes hit stocks in 2022, and it has never closed since then. This helps explain why Walmart has benefitted so much during this bull market. The return of mean reversion | This doesn’t mean that valuations will never return to the mean. It just might take longer. After the valuation super cycle top in 1959, decade-long returns in an inflation-adjusted S&P 500 were still near 160% four years later, about 2/3 of the peak. By late 1966, that number was as low as 35% . That’s over 200% lower decade-long returns than the peak seven years earlier, even though a recession didn’t occur until over three years later in December 1969. This kind of outcome today is less likely without a recession while people are still adding money to their retirement accounts. The risk is that when a downturn does come, the market’s return to the mean will be happening from a much higher level than it would have if smaller adjustments had taken place in the meantime. One more thought on passive. If stocks act as a vehicle for momentum because of passive fund flows, then the equity market is more likely to be a lagging signal of recession than a leading one. By the time stocks react to a recession, we could be shocked to find out that it’s already here. |