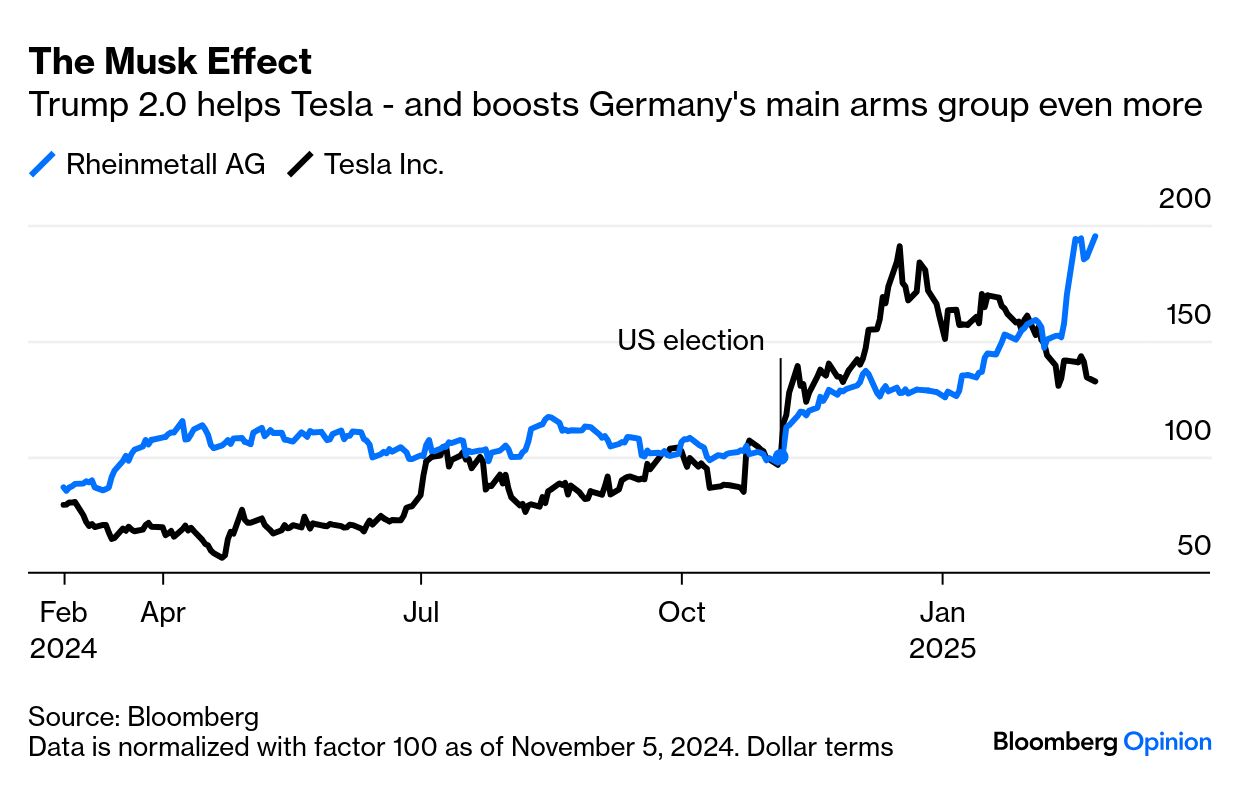
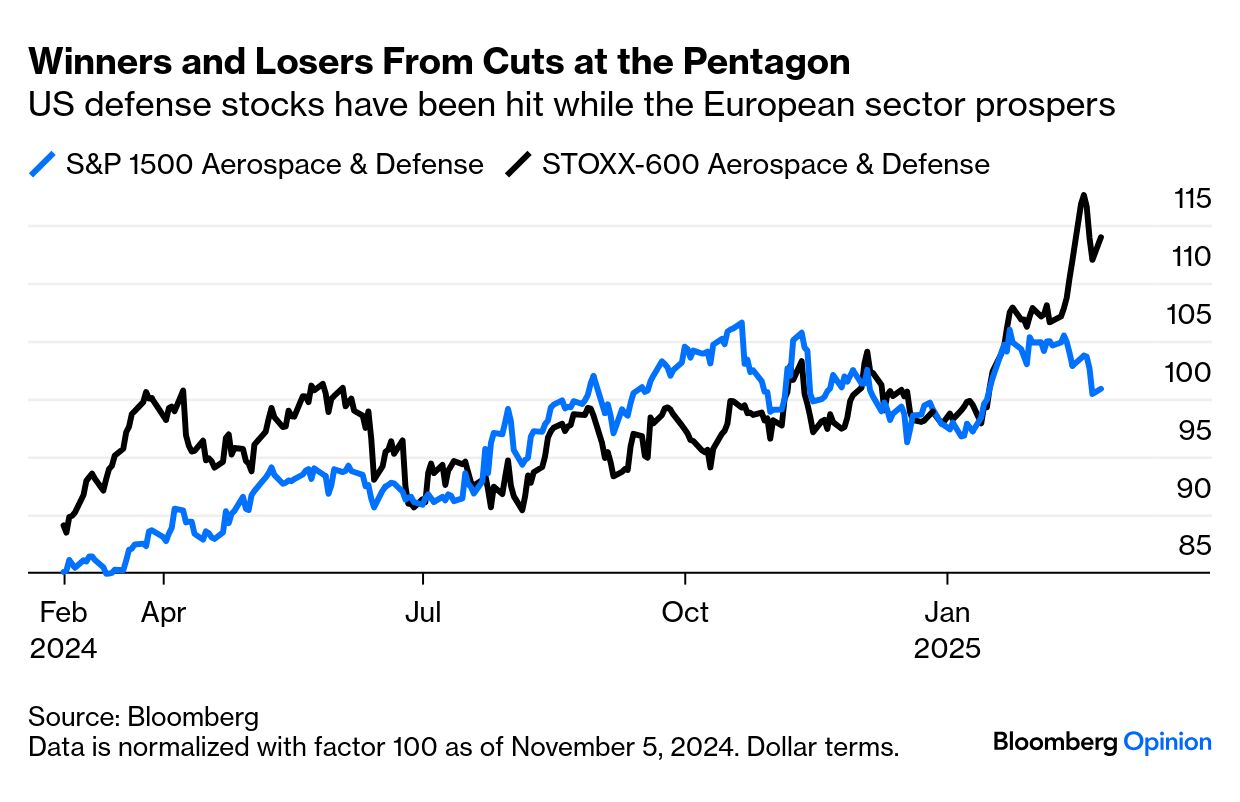
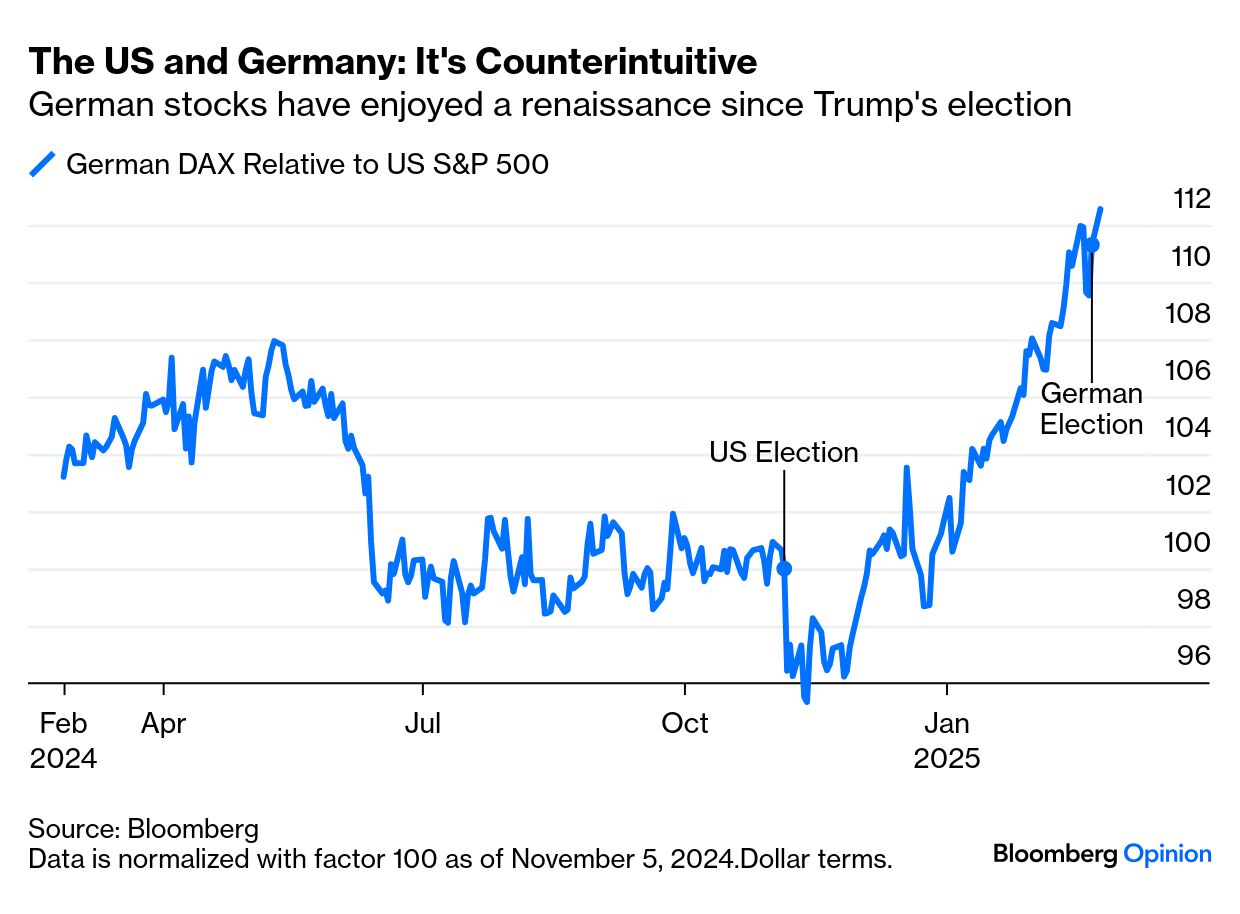
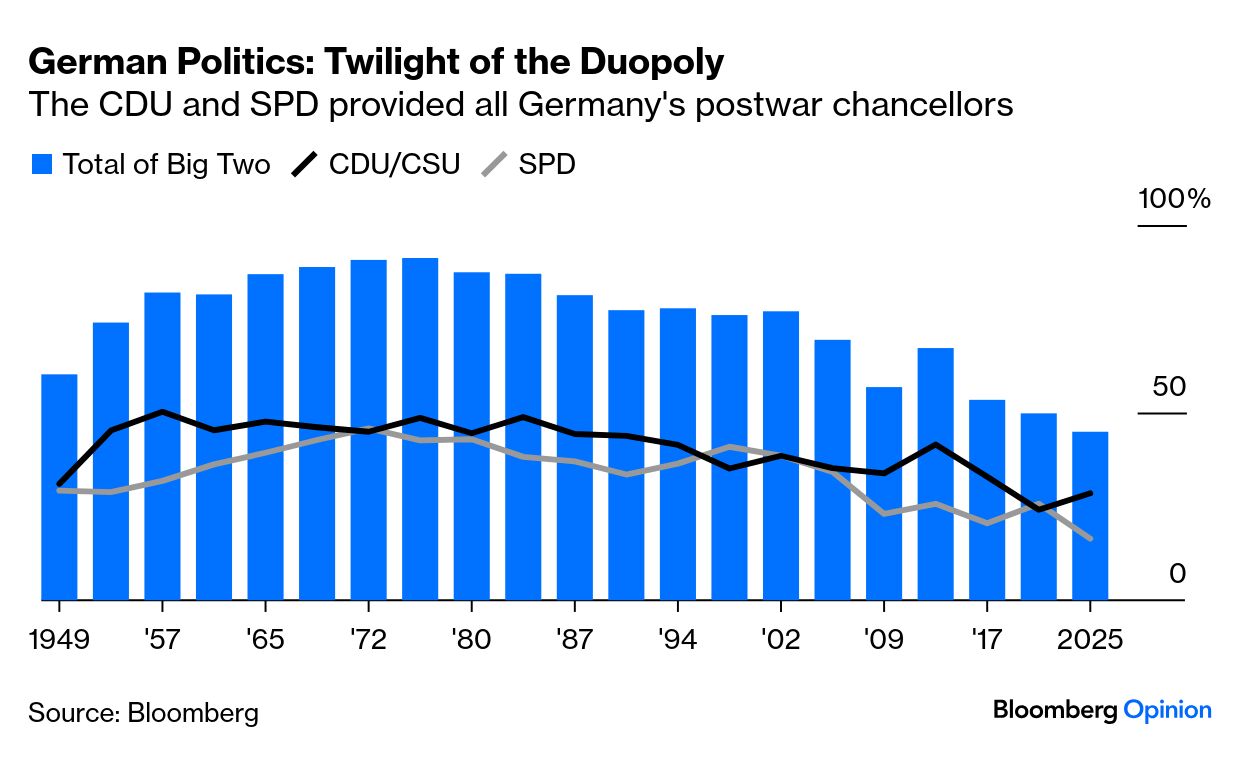
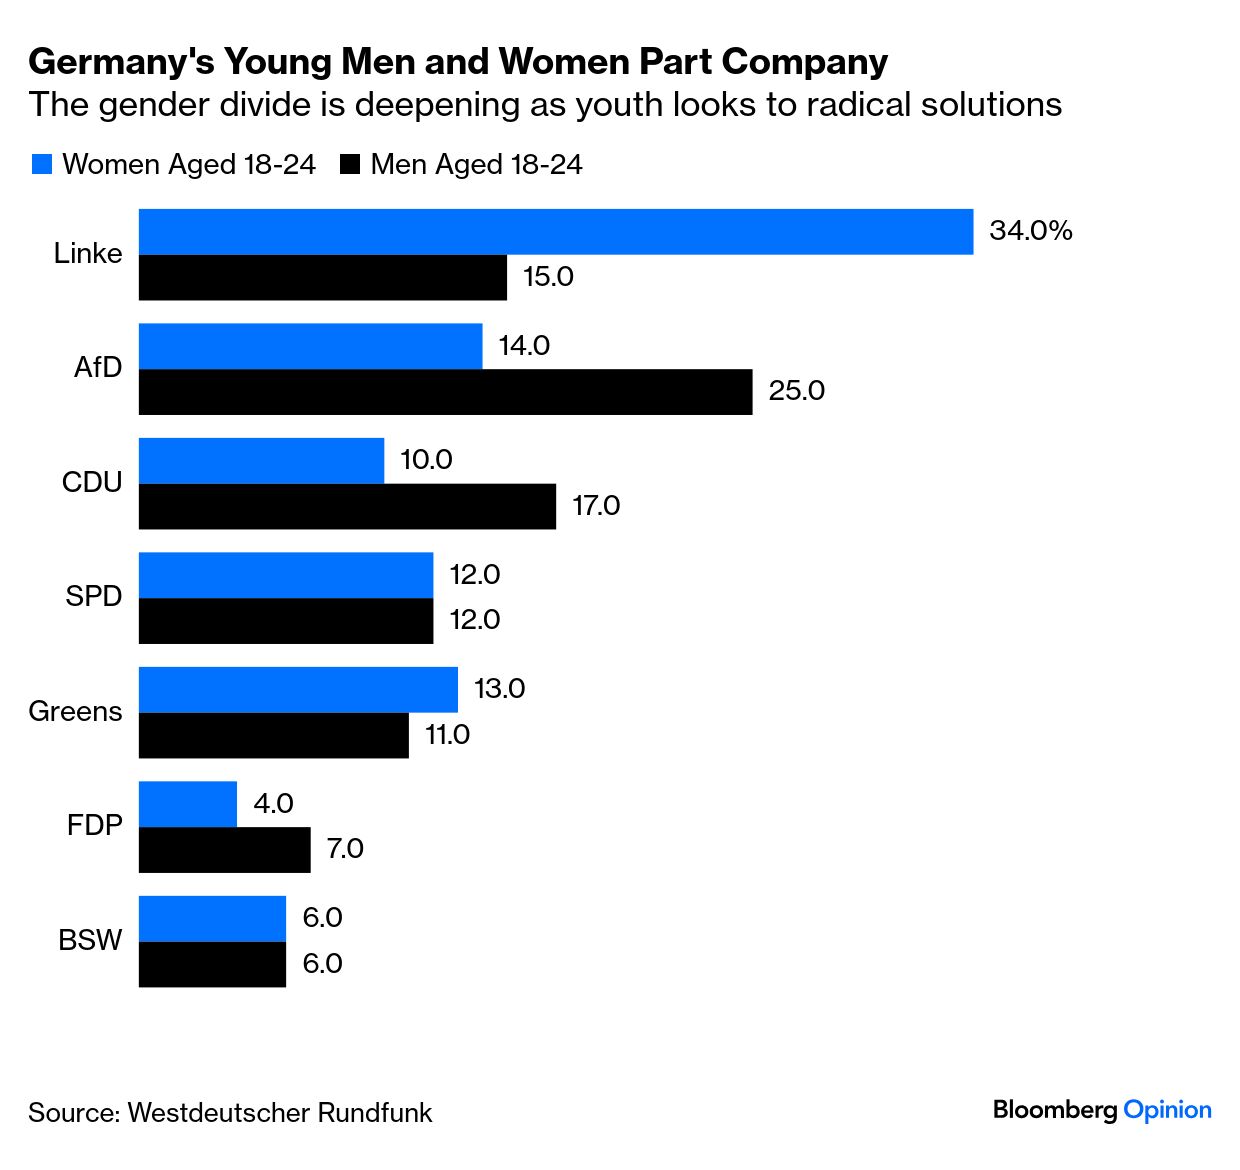
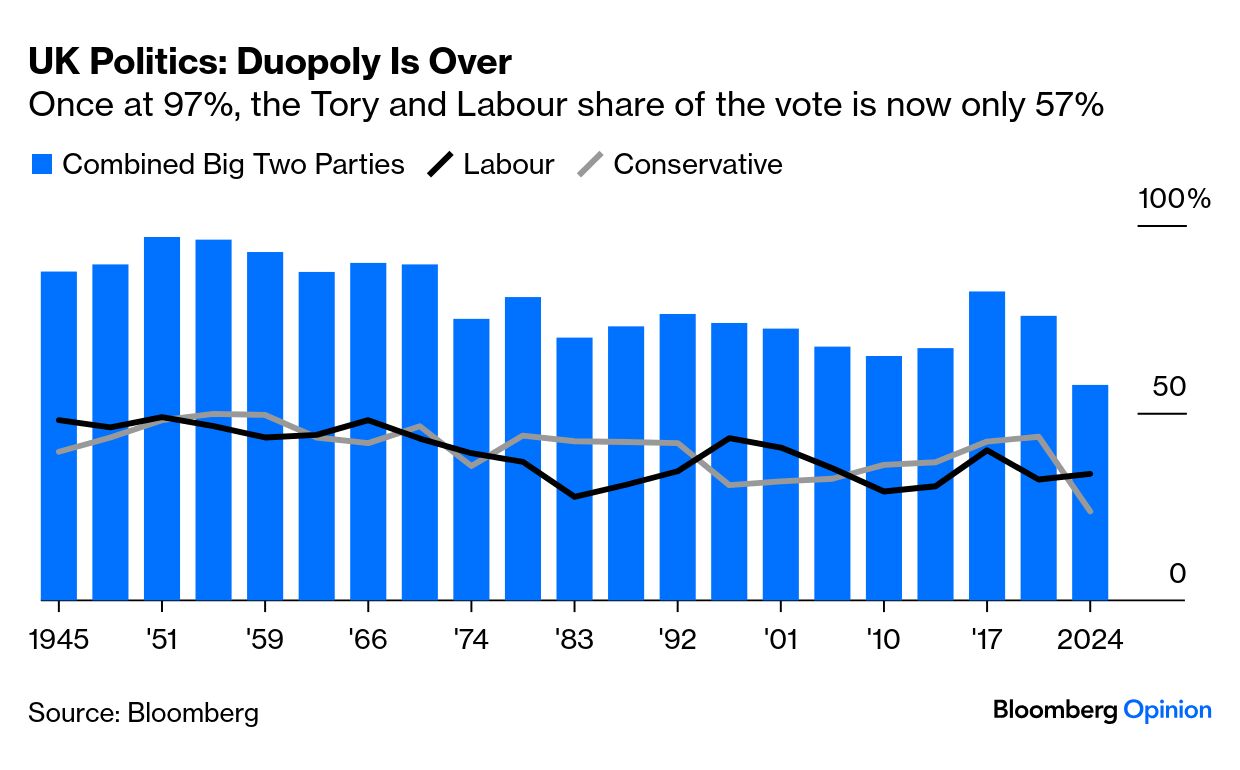
| Politics are too dramatic for comfort, and they’re having unpredictable market impacts. The Trump 2.0 move to cut back federal spending (even on defense), spearheaded by Elon Musk, saw Tesla Inc.’s stock almost double after the election. It’s now given most of that back. But Rheinmetall AG, Germany’s largest arms maker, has boomed as the Trump 2.0 retreat from the transatlantic alliance prompts calls for a splurge of European defense spending. Remarkably, as DOGE runs riot, an old-school German industrial group is far outperforming Tesla: At a sectoral level, the US defense sector is back where it was on Election Day, while Europe’s has surged since Vice President JD Vance’s speech to the Munich security conference: Meanwhile, Germany’s stocks are rampant, while the US is finding it hard to advance: This is all counterintuitive, given the arrival of a pro-growth US president, and a deepening crisis for Germany’s traditional leaders. How to reconcile this? Tiny margins and shifts in electoral rules can have massive effects. Germany’s two big traditional parties would not be able to form an alliance on their own, and the domestic stock market would almost certainly have fallen Monday if the left-wing BSW party had reached the 5% threshold needed for representation in parliament. It won 4.97%. Had it found another 15,000 votes, it would have thwarted a Grand Coalition. Despite that narrow escape, the mainstream Christian Democrats and Social Democrats’ duopoly looks doomed. They jointly polled less than 50%: Exit polls suggest this will accelerate, as youth is implacably opposed to the status quo, with a deep gender divide. Among under-24s, women’s favorite party was Die Linke (descended from the old East German communists). Men favored the hard-right Alternative für Deutschland: The existing German way of doing business survives thanks to an electoral quirk, and divisions among the populists; but the move to the extremes looks irresistible. Germany is not alone. This is the same exercise for Britain’s Labour and Conservative parties. Their combined support in last year’s election was barely above 50%, the lowest since the war: Long-term, the political establishment in Europe’s biggest countries is giving way to something much more unpredictable. That’s very significant. But neither the UK nor Germany need have another election for four years. Until then, the status quo parties have another chance. Does that make their stock markets a buy? Morningstar’s intrinsic valuation measure of 700 US stocks traded at a 4% premium to its fair value estimates at the start of the year. Since the end of 2010, that’s happened for less than 10% of the time, while growth stocks command an even bigger premium of more than 20%. That makes other countries, even Germany, look more exciting; they’re cheaper, but are they better value? Do they offer better returns in future? Robeco Quant’s chief researcher, David Blitz, approaches the question by decomposing equity returns into earnings growth and multiple expansion. This distinguishes between returns driven by fundamentals — dividends and earnings growth — and those influenced by sentiment. Applying this to MSCI’s annualized total returns reveals key differences in the reasons why other regions of the world are lagging the US. Here’s the past decade: 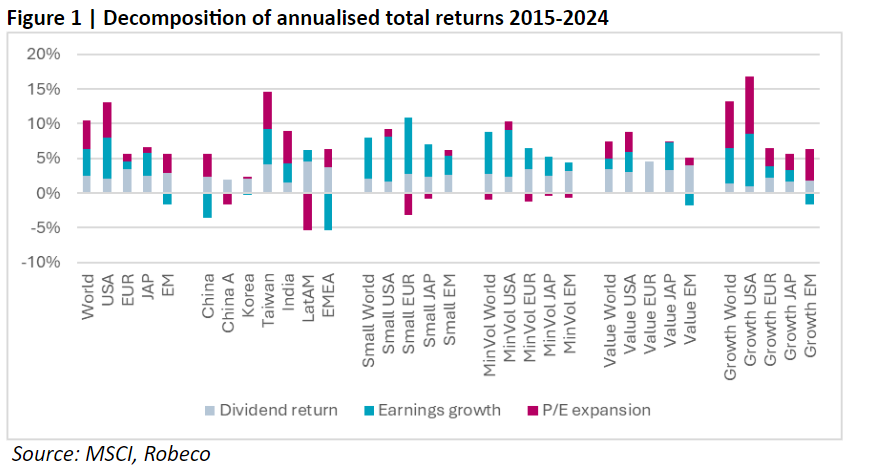 Blitz shows that US small-cap and low-volatility stocks have delivered strong earnings growth, but suffer from stagnant valuations. The same is true of Europe, where small caps’ multiples contracted even as they grew their earnings faster than their US peers. EM equities, recently back in favor after their longest streak of weekly gains since 2020, disappointed largely because earnings didn’t grow. Their valuations (outside Latin America and the Chinese mainland) rose nicely. Taiwan and India posted solid earnings growth, though not enough to offset poor performance from China, Korea, and EMEA. So the nub of the problem for small caps and low-volatility stocks, says Blitz, is that they lack investor appreciation, while EM companies need to turn around their operating performance: Small-cap stocks consistently delivered stronger earnings growth than large caps. Based purely on fundamental returns, European small caps led all indices. However, their stagnant valuations constrained total returns, particularly in the US. Similarly, low-volatility stocks posted robust earnings growth but failed to see valuation increases.
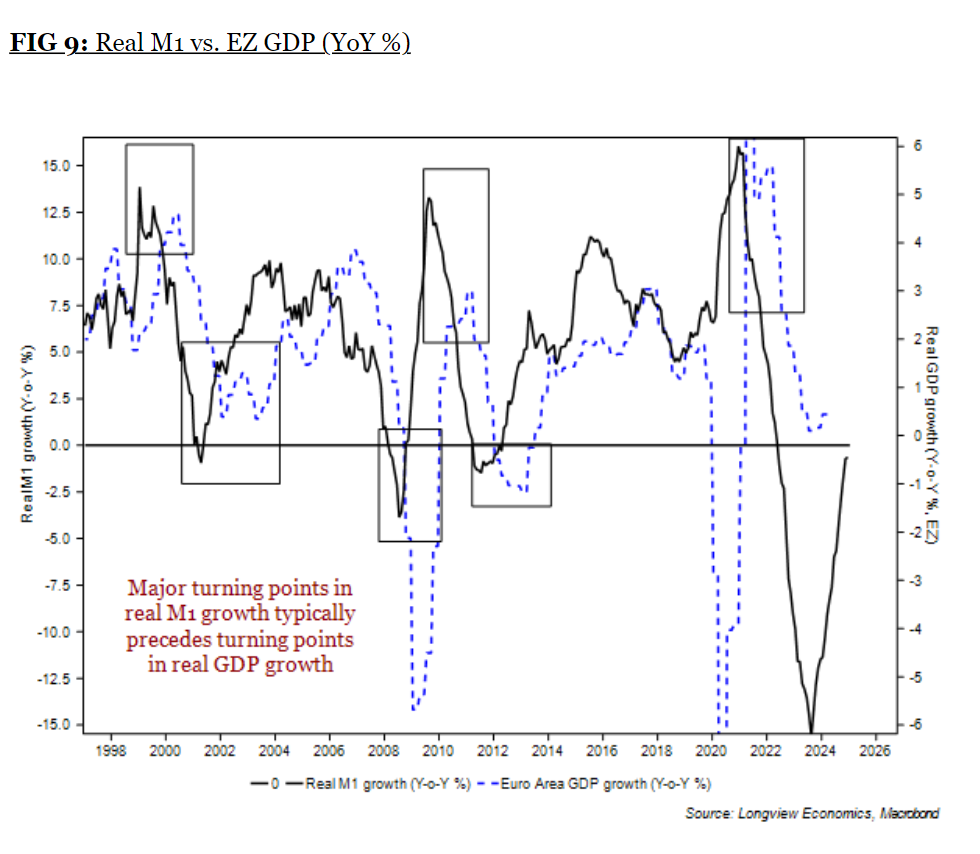
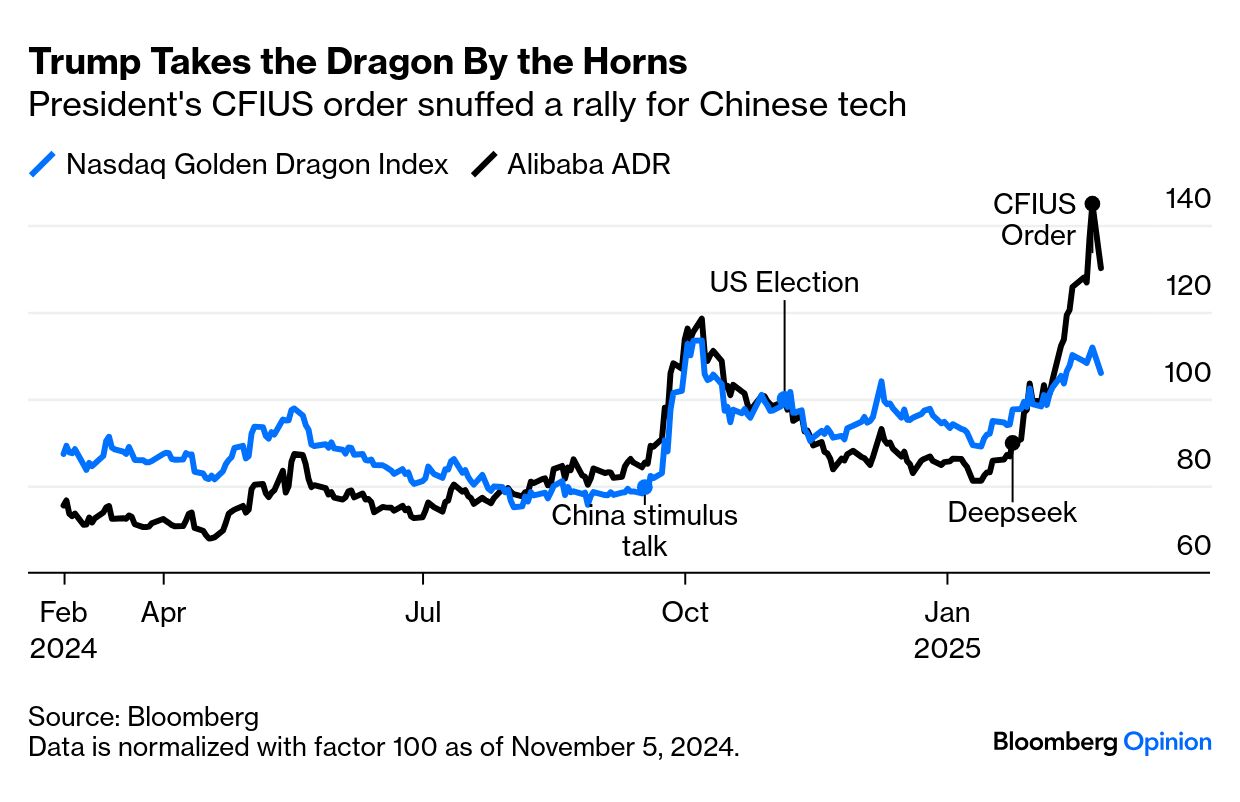
Europe, like Japan, recorded modest earnings growth and disappointing valuations. That makes the rally in European equities — just as the region landed in acute political difficulties — even more impressive. Where is this resurgence coming from? Longview Economics suggests idiosyncratic factors have helped European stocks move higher in anticipation of an end to the Russia-Ukraine war. If that happens, gas pipelines may reopen, resulting in energy disinflation and a looser, more stimulative path for the European Central Bank. Can the rallies be sustained? The answer lies in a shift in key macro themes — an emerging soft patch in the US economy and evidence that the euro zone is starting to respond to ECB loosening. Longview illustrates this resurgence with the acceleration in real M1 money supply growth — which typically leads to real gross domestic product growth: Further, US policy uncertainty poses great risks — which carries with it the hope that there will be a nice rebound when the situation is clearer. EM’s equities rally stalled Monday after Trump directed the Committee on Foreign Investment in the United States to restrict Chinese spending on technology, energy, and other strategic US sectors. The latest executive order comes after a “truce” between Beijing and its tech billionaires, following swiftly from news about the DeepSeek AI app, had ignited hopes that Chinese technology companies could make a big push into artificial intelligence. Alibaba Group Holding fell as much as 11% in US trading, the biggest loss since 2022, while a gauge of Chinese technology stocks listed in Hong Kong tumbled. China says it doesn't want a trade war, but one looks increasingly hard to avoid. Political risk grows ever harder to gauge. For the longer term, diversifying to take advantage of stocks whose valuations have been left behind looks like a good idea. But how to gauge when stocks are cheap? —Richard Abbey The most popular measure of long-term value is also the center of the investment profession’s most intense debate: Should we take CAPE seriously? The cyclically adjusted price/earnings multiple, promulgated by Benjamin Graham in the 1930s and popularized by the Yale economist Robert Shiller in the 1990s, compares an index level with its average earnings over the previous 10 years. This controls for traders’ attempt to take account of the economic cycle (multiples are higher when people expect things to improve, and lower when they’re expected to get worse). Shiller updates his numbers monthly and publishes a chart and spreadsheet at shillerdata.com. This is his current chart, published with 10-year rates as a comparison: 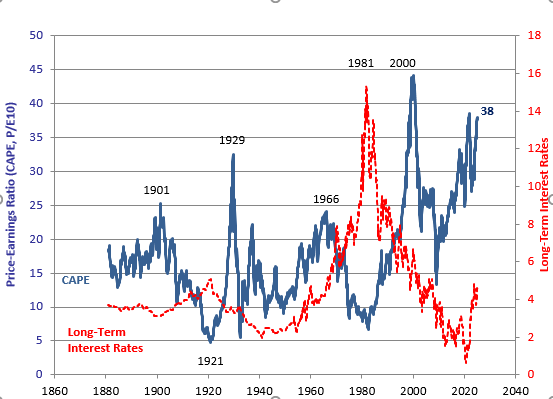 The epic selling opportunities of 1929 and 2000, and the great chance to buy in 1981, are obvious. Things aren’t quite as overblown as in 2000, but as the ratio is higher now than on the eve of the 1929 Great Crash, even though 10-year yields are higher, it suggests we should run for the hills. Now arises the problem. CAPE has been historically high for more than a decade. Until 2021, low bond yields supported this, but that’s no longer true. And still CAPE constantly warns that stocks are expensive, even as the market surges. This tended to deter asset allocators from being all-in on US stocks for the last 15 years, but that was the thing to do. As a result, there’s a cottage industry revising CAPE so that it’s no longer so scary, or giving reasons to junk the whole thing. Twelve years ago, I wrote this piece on the differences in opinion between Shiller and Jeremy Siegel, two titans of academic finance, which they subsequently debated at the CFA Institute’s annual conference. The argument has intensified since. Attempts to adjust CAPE have included adjusting earnings for changing accounting standards and for changes in tax policy. Now, Research Affiliates has a broadside in defense of CAPE. It’s a long paper that you can find here, and which everyone interested in valuation should read. (They make you register but it’s free.) Their key insight is to take the average 10-year earnings of the current components of the index, rather than of the index itself. This tends to raise the CAPE as new companies entering still be in a growth phase without yet amassing the earnings of the declining companies demoted to make way for them. Most of the time, the adjustment makes little difference. In 2000, however, it raised the CAPE from a scary 40 to a stratospheric 70: 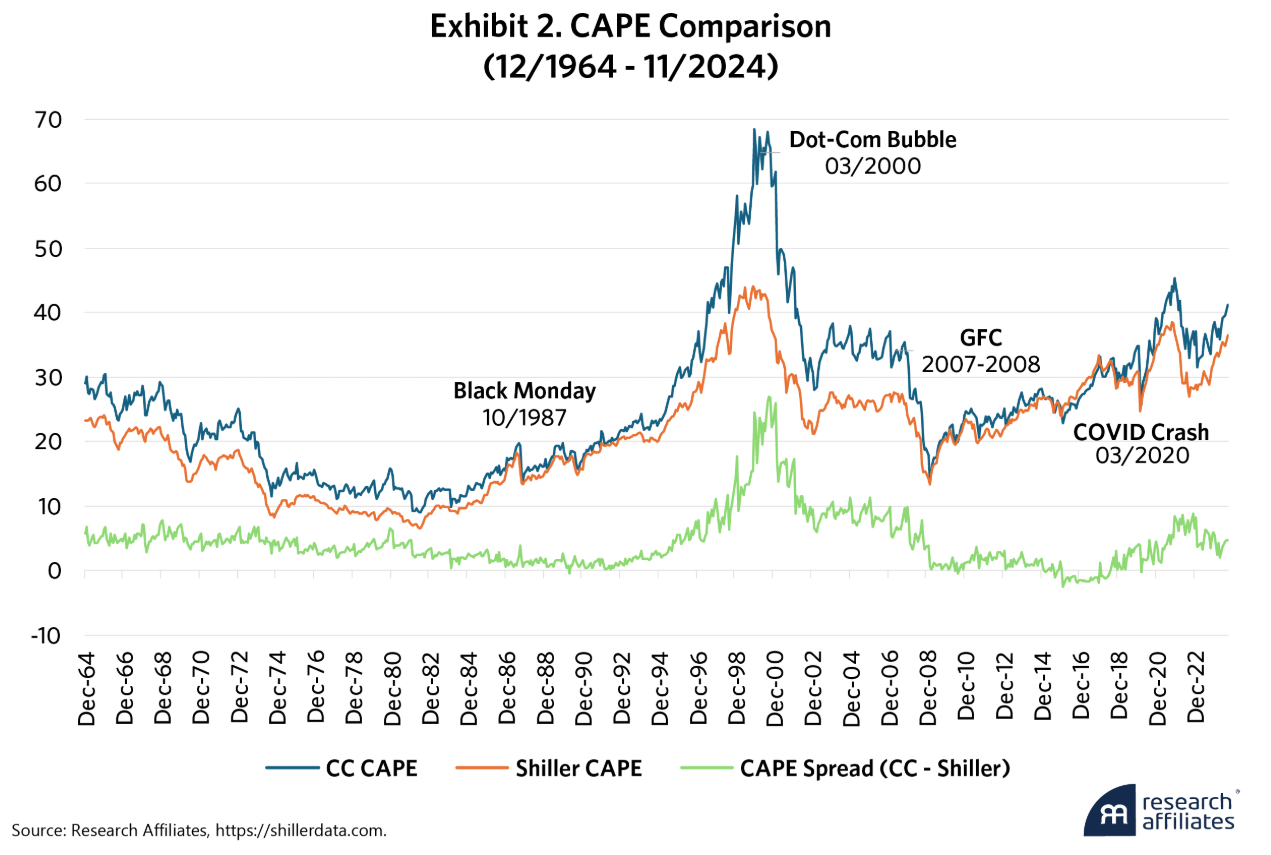 Source: Research Affiliates The index still looks expensive, so the bottom line remains that this isn’t a great time to buy. But it no longer looks like a compelling sell. It’s also less overextended than in the “fools’ rally” that ended in 2007. Que Nguyen of Research Affiliates explains that the companies entering the index now tend to have made some earnings already, and so CAPE measured this way is much less elevated. Further, Research Affiliates argues that the “CAPE Spread” — the excess of the CAPE calculated on current components over Shiller’s version based on index earnings — can help with timing. Its extreme in 2000 was a correct instruction to get out of the market, and it didn’t return to zero until 2009, when it was safe to buy. It’s currently above zero but not extreme. Nguyen argues: What’s driving the market is AI and its potential, and it’s very similar to bubbles we’ve seen in the past. If you believe that AI is just not going to have an impact, then you should get of the market and this doesn’t tell you much. If you believe is is going to have an impact and drive more optimism, then you shouldn’t get out until the optimism goes too far. At some point it will be way over-priced. What the CAPE spread is telling you is that you shouldn’t get out yet.
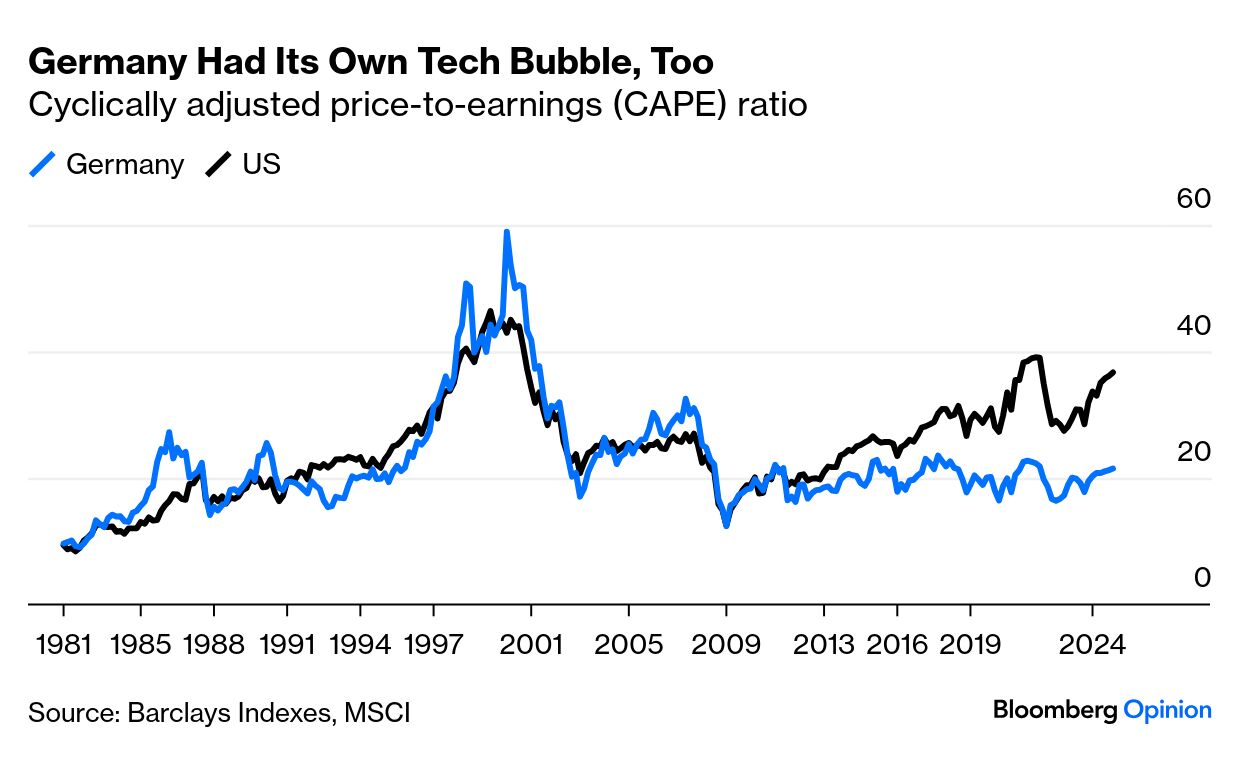
CAPE also sheds light on the comparison between US and German stocks. Fascinatingly, Germany was even more overblown in 2000 than the US, but now they sell at barely half the US multiple. Until the Global Financial Crisis in 2009, they tracked each other closely. The current chasm developed over the last 15 years. These numbers are from Barclays, using Shiller’s methodology: Since the GFC, something has knocked the confidence out of investors in Germany. Deepening problems for the political model are a reason, but it’s hard to say that’s not now adequately priced. Risks abound, but they just about favor Germany. Despite everything. Rest in Peace, Roberta Flack, who has passed away at 83. She could sing. Listen to her in Killing Me Softly (even better than the Fugees’ version), The First Time Ever I Saw Your Face (for a contrast, here is the first recording by Peggy Seeger of the song written by Ewan MacColl); her beautiful version of the Shirelles’ Will You Still Love Me Tomorrow (also tried by Taylor Swift and Amy Winehouse), and Back Together Again. Like Bloomberg's Points of Return? Subscribe for unlimited access to trusted, data-based journalism in 120 countries around the world and gain expert analysis from exclusive daily newsletters, The Bloomberg Open and The Bloomberg Close. More From Bloomberg Opinion: Want more Bloomberg Opinion? OPIN . Or you can subscribe to our daily newsletter. |