
|
A 1% Fund Fee Sounds Tiny. Over 30 Years It Steals $400,000
Most 401(k) menus quietly charge 5x more than they should. Here's how to spot it before it eats your retirement.
|

| |||||||||||||||


Quick gut-check question. If I told you a fund charged 1% per year, would you blink?
Most people don’t. One percent sounds like a rounding error. Your phone bill went up more than that last year and you didn’t even notice. The problem is, fund fees don’t work like phone bills. They compound, against you, on a balance that’s growing every year. And over a 30-year career, the math turns ugly fast.
This is the most boring six-figure mistake in personal finance — and almost nobody catches it on themselves.
How does a 1% fee actually cost you so much?
Imagine three people, each with $100,000 saved and adding $10,000 a year. They all earn the same 8% before fees. The only thing that changes is what their fund charges:
Person A holds a low-cost index fund (~0.08% fee — the asset-weighted average for the largest passive index funds in 2025).
Person B holds the average actively managed mutual fund (~0.65% fee, per ICI).
Person C is in a legacy 401(k) plan that charges around 1.00% all-in.
After 30 years, here’s what those identical investments actually grow into:
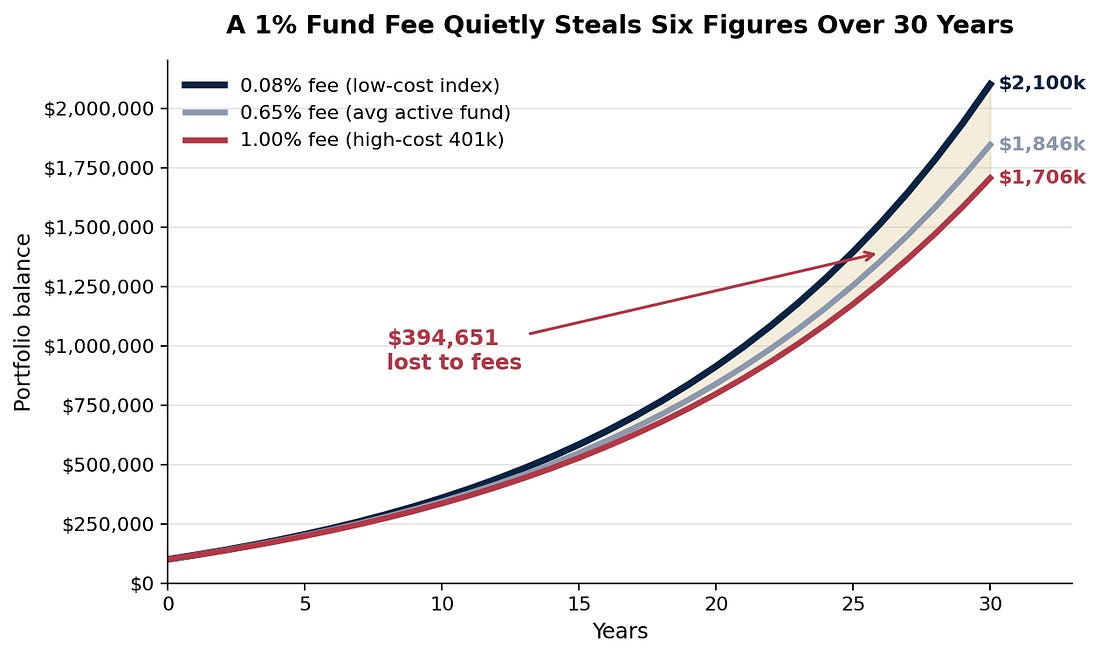 |
Same starting balance. Same contributions. Same gross return. The 1% person ends up with roughly $414,000 less than the low-cost person. That’s not bad luck. That’s a fee, deducted year after year, on a balance that keeps getting bigger.
Why is this hidden in plain sight?
Three reasons. First, fund fees don’t show up on your statement as a line item — they’re netted out of the share price before you ever see it. Second, your 401(k) menu often labels expensive funds with friendly names like “Diversified Growth” or “Strategic Income,” which sound responsible. Third, your HR rep isn’t a fiduciary. They’re not going to walk you through the prospectus line by line.
The result? Most people genuinely don’t know what their funds cost. The 2024 ICI report shows the average equity mutual fund expense ratio is 0.40%, but that’s the average — small-plan 401(k)s routinely run 0.99% or higher. If you work for a small employer, the odds are not in your favor.
Action this week: Open your 401(k). Click each fund. Find the “expense ratio” or “net annual operating expense.” Anything over 0.50% deserves a second look. Anything over 0.75% is almost certainly costing you more than the fund is delivering. Look for whatever index fund or target-date index fund is on the menu — it’s usually under 0.10%.
“But the active fund could outperform, right?”
This is the argument the high-fee fund is built on. The data, unfortunately, doesn’t agree. The S&P SPIVA scorecard — which tracks active vs. passive managers across 25 years — shows that over a 15-year window, roughly 88% of large-cap active funds underperform their benchmark. Some pick stocks well; almost none beat the math of fees plus turnover plus tax drag.
So you’re paying 5 to 25x more in fees for a 12% chance of beating the index. That’s not investing. That’s a slot machine with a velvet rope.
The one-line version
You can’t control returns. You can control fees. And fees, compounded for 30 years, are the difference between a comfortable retirement and a nervous one.
Sources
Vanguard — 0.06% asset-weighted average expense ratio (2026) — https://corporate.vanguard.com/content/corporatesite/us/en/corp/articles/vanguard-delivers-landmark-cost-savings.html
Investment Company Institute — Trends in fund fees, 2024 — https://www.ici.org/files/2025/per31-01.pdf
NerdWallet — Average expense ratios by fund type — https://www.nerdwallet.com/investing/learn/mutual-fund-expense-ratios
Truthifi — 2026 401(k) expense ratio benchmarks — https://truthifi.com/education/good-401k-expense-ratio-benchmarks-fee-guide
S&P SPIVA Scorecard — active vs. passive performance — https://www.spglobal.com/spdji/en/research-insights/spiva/
Disclaimer
Affluent Notes is for educational and entertainment purposes only. Nothing in this newsletter is financial, tax, legal, or investment advice. The numbers, charts, and strategies discussed are illustrative; your situation, tax bracket, plan rules, and risk tolerance are different. Past performance does not guarantee future results. Talk to a licensed CPA, CFP, or attorney before acting on anything you read here. The author may hold positions in securities or accounts mentioned.
Affluent Notes is free today. But if you enjoyed this post, you can tell Affluent Notes that their writing is valuable by pledging a future subscription. You won't be charged unless they enable payments.
|