|
If you’ve been looking at SCHD lately and feeling disappointed that it hasn’t kept up with the S&P 500, you’re not alone.
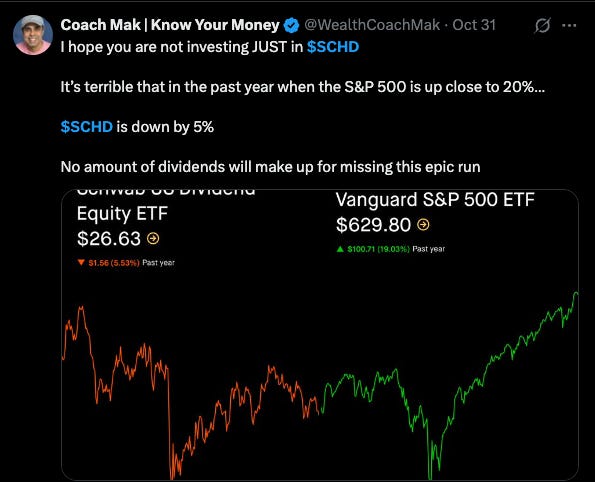
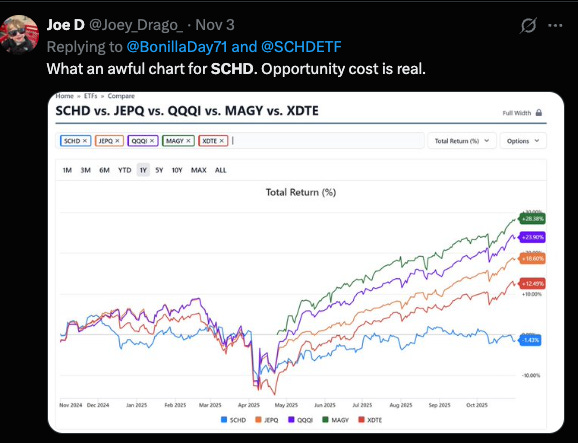
Social media is full of posts like this - charts comparing price performance, hot takes about “underperformance,” and calls to dump SCHD for an S&P index fund.
But here’s the truth:
If you’re comparing SCHD’s price chart to the S&P 500’s, you’re asking the wrong question.
Different Goals, Different Metrics
The S&P 500 (and the funds that track it — SPY, VOO, etc.) exist for one main purpose:
Capital appreciation.
Their goal is to match the total return of the U.S. stock market.
So naturally, when you analyze them, you look at metrics like:
Earnings growth - what’s driving long-term returns
Valuation (P/E ratio) - how much investors are willing to pay for those earnings
Total return - price appreciation + dividends
But SCHD’s mission is entirely different.
Its goal isn’t price growth. It’s reliable, growing income.
So when you measure SCHD’s success, you need to use a different scorecard:
Dividend yield - how much income your money earns now
Dividend growth rate - how fast that income grows over time
Payout consistency - whether it keeps rising through good and bad markets
A Tale of Two Markets
Let’s look at how different these funds really are.
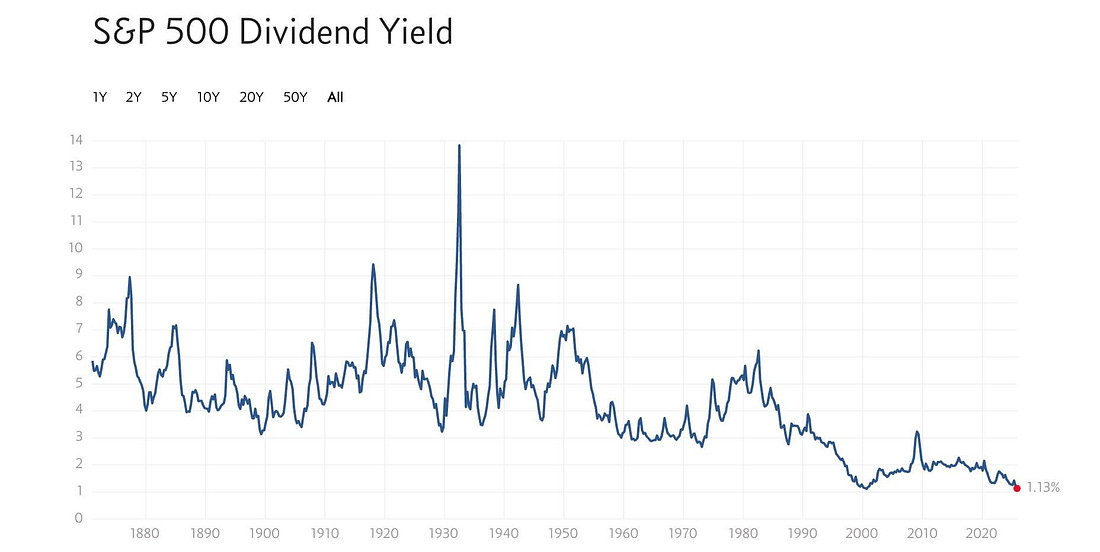
The S&P 500’s dividend yield has been shrinking for decades - down to around 1.1%, one of its lowest levels ever.
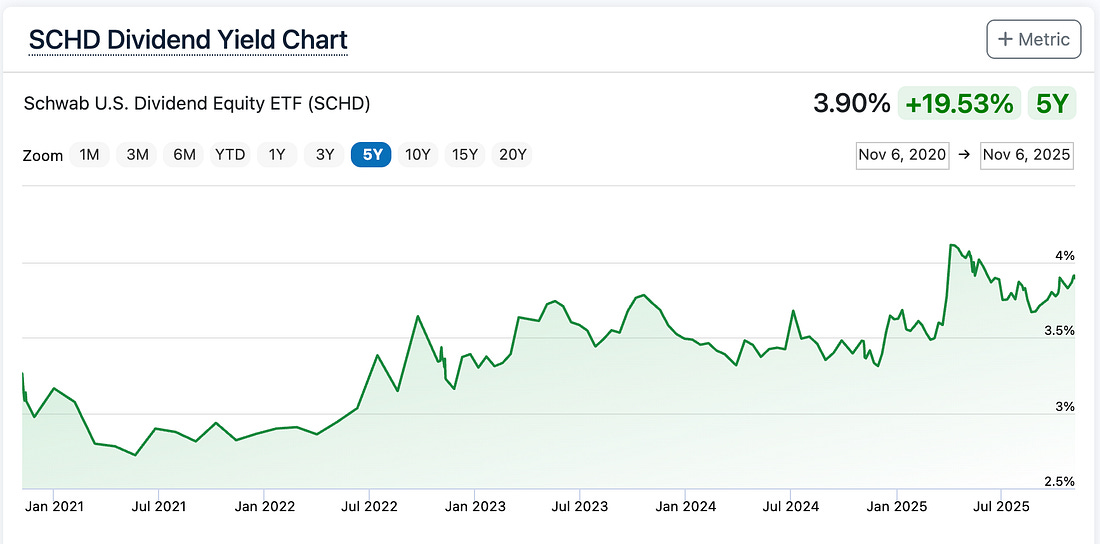
SCHD, on the other hand, typically yields between 3% and 4% - roughly 3x more income per dollar invested.
So if you’re an income-focused investor, SCHD plays the same game you do.
It’s also worth noting how differently the two are priced.
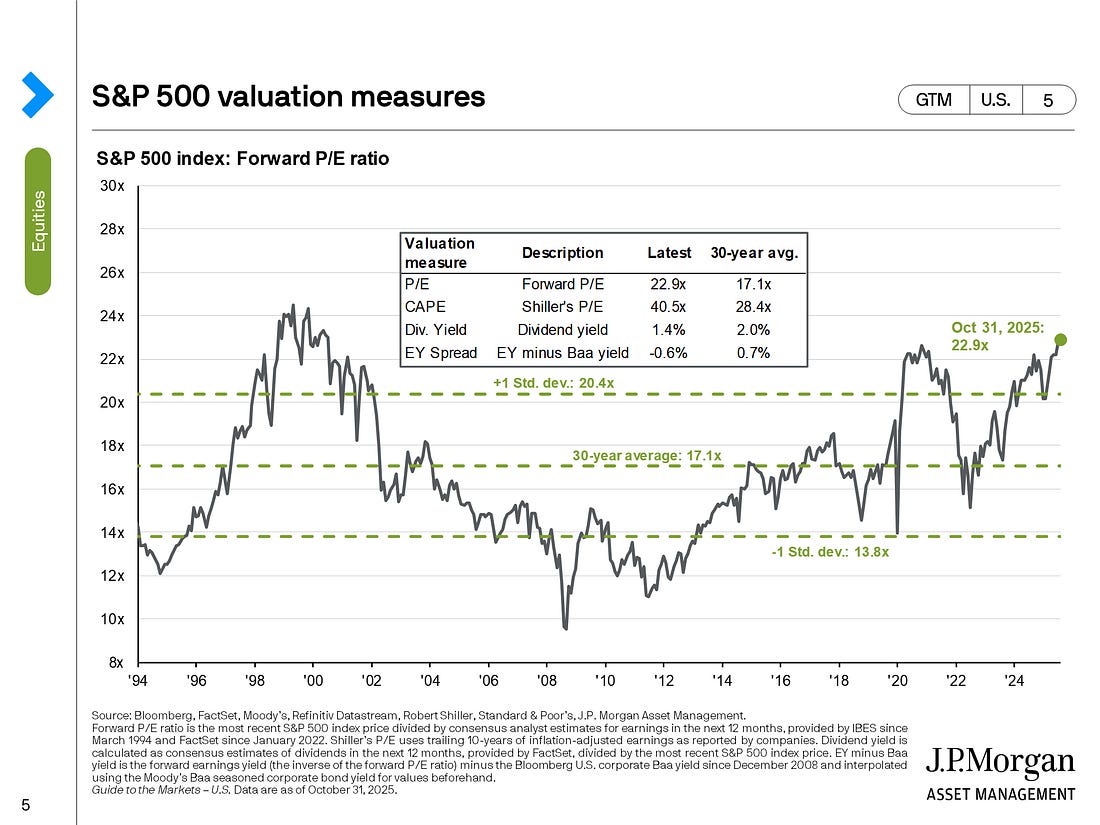
The S&P 500’s forward P/E ratio is sitting above its long-term average, meaning investors are paying a premium for every dollar of earnings.
SCHD’s holdings, by contrast, are much cheaper.
